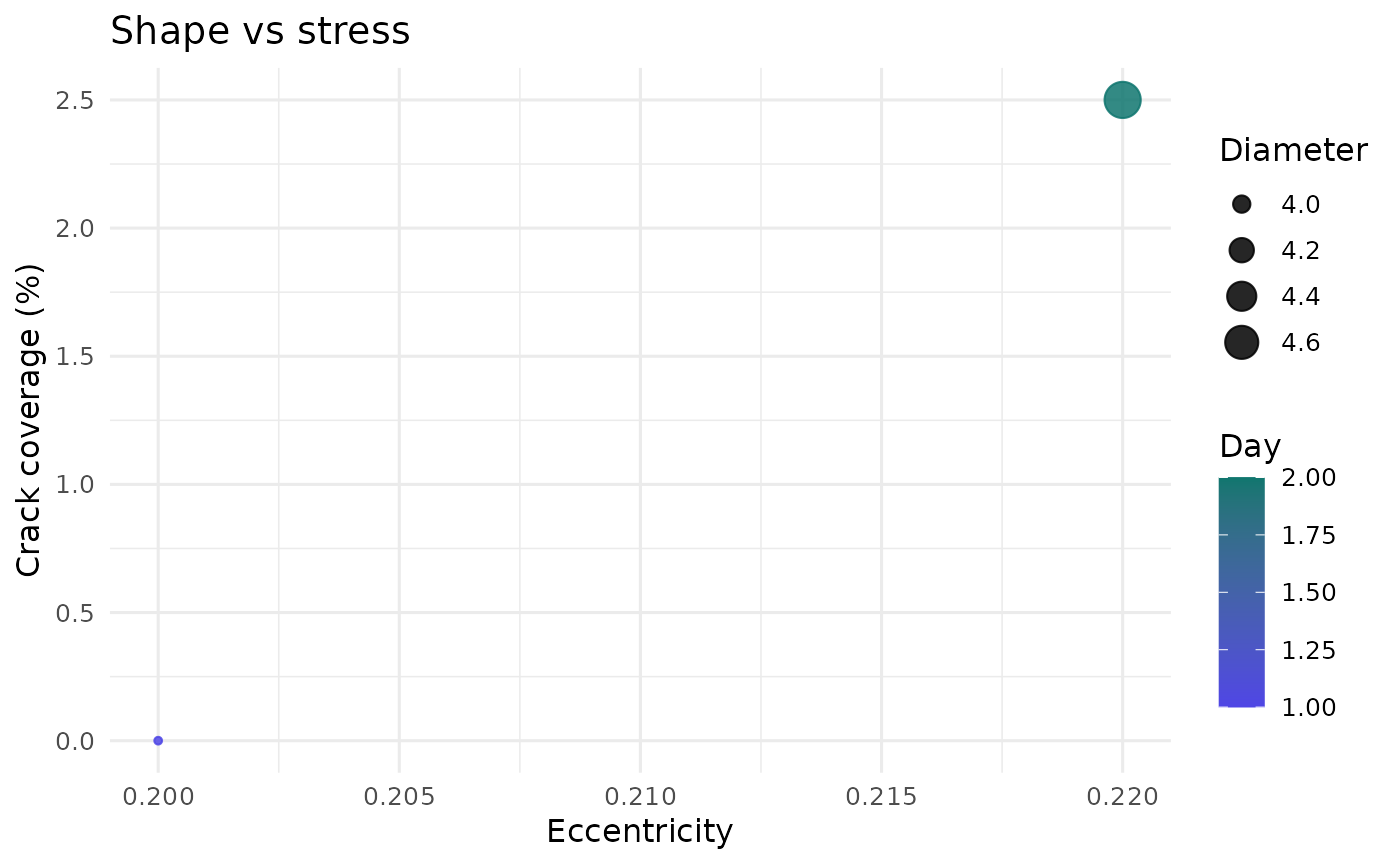
Plots eccentricity against crack coverage percentage, with point size proportional to colony diameter and colour encoding time (day).
Arguments
- x
A
grayleafspot_runobject or data accepted byas_grayleafspot_growth_data().
Examples
run <- example_grayleafspot_results()
plot_shape_vs_stress(run)