Plot radial growth rate and colony area by plate over time
Source:R/plots.R
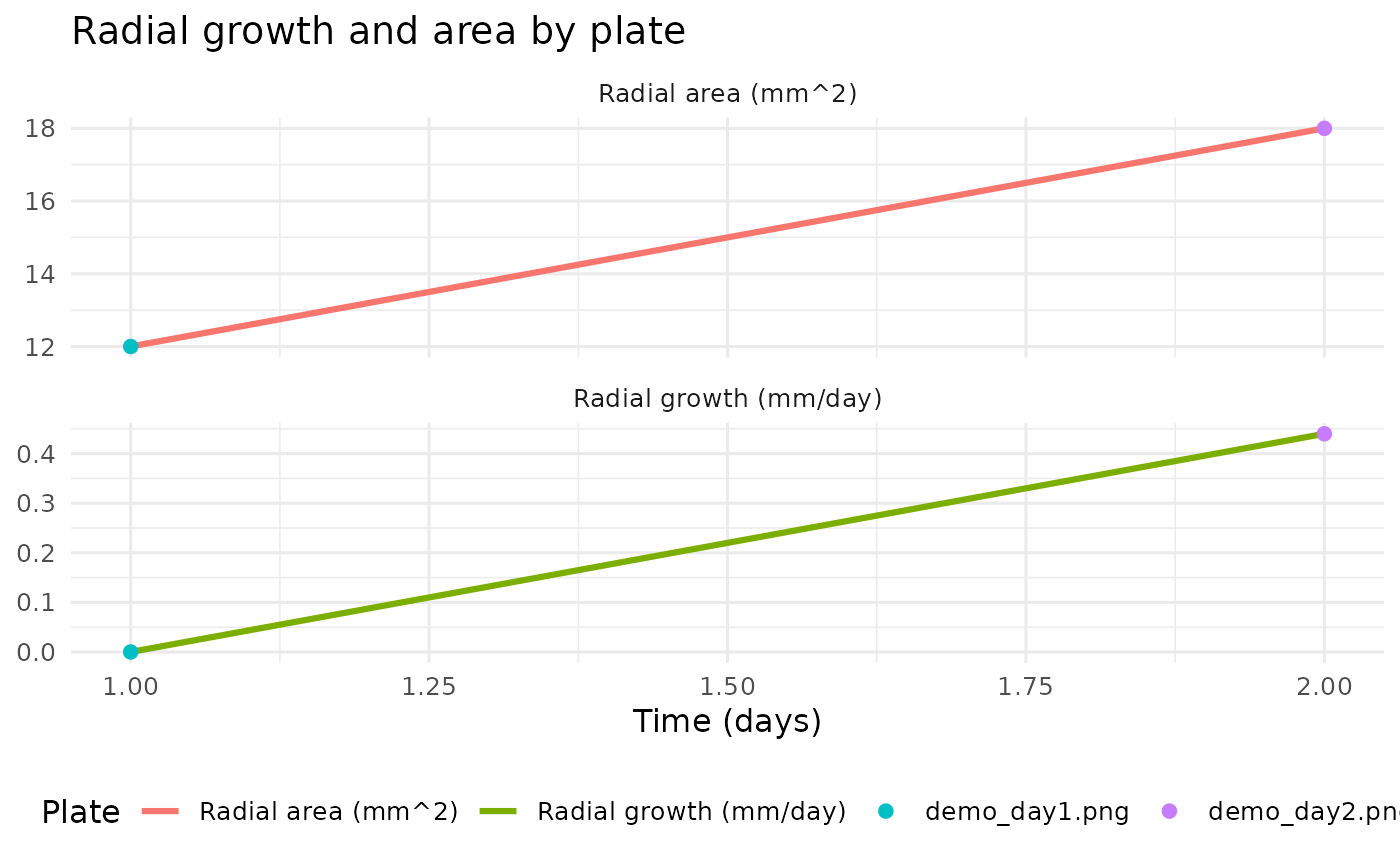
plot_radial_growth_area.RdProduces a faceted panel with colony area (mm\(^2\)) on one facet and radial growth rate (mm/day) on the other. When each plate appears only once in the data, points from all plates are connected in day order.
Arguments
- x
A
grayleafspot_runobject or data accepted byas_grayleafspot_growth_data().
Examples
run <- example_grayleafspot_results()
plot_radial_growth_area(run)