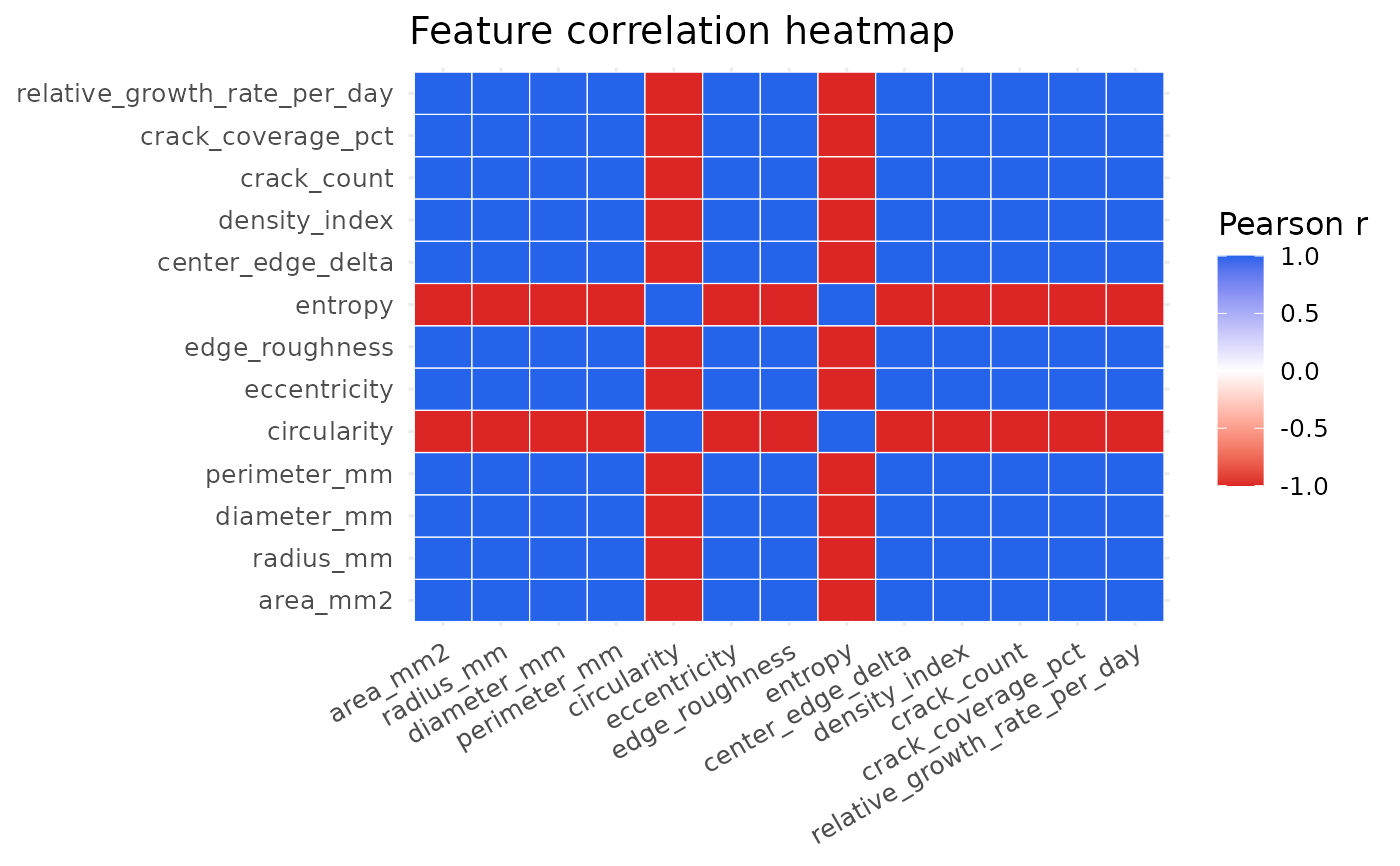
Pearson correlation heatmap of numeric morphology features
Source:R/plots.R
plot_feature_heatmap.RdPearson correlation heatmap of numeric morphology features
Arguments
- x
A
grayleafspot_runobject or data accepted byas_grayleafspot_growth_data().
Examples
run <- example_grayleafspot_results()
plot_feature_heatmap(run)