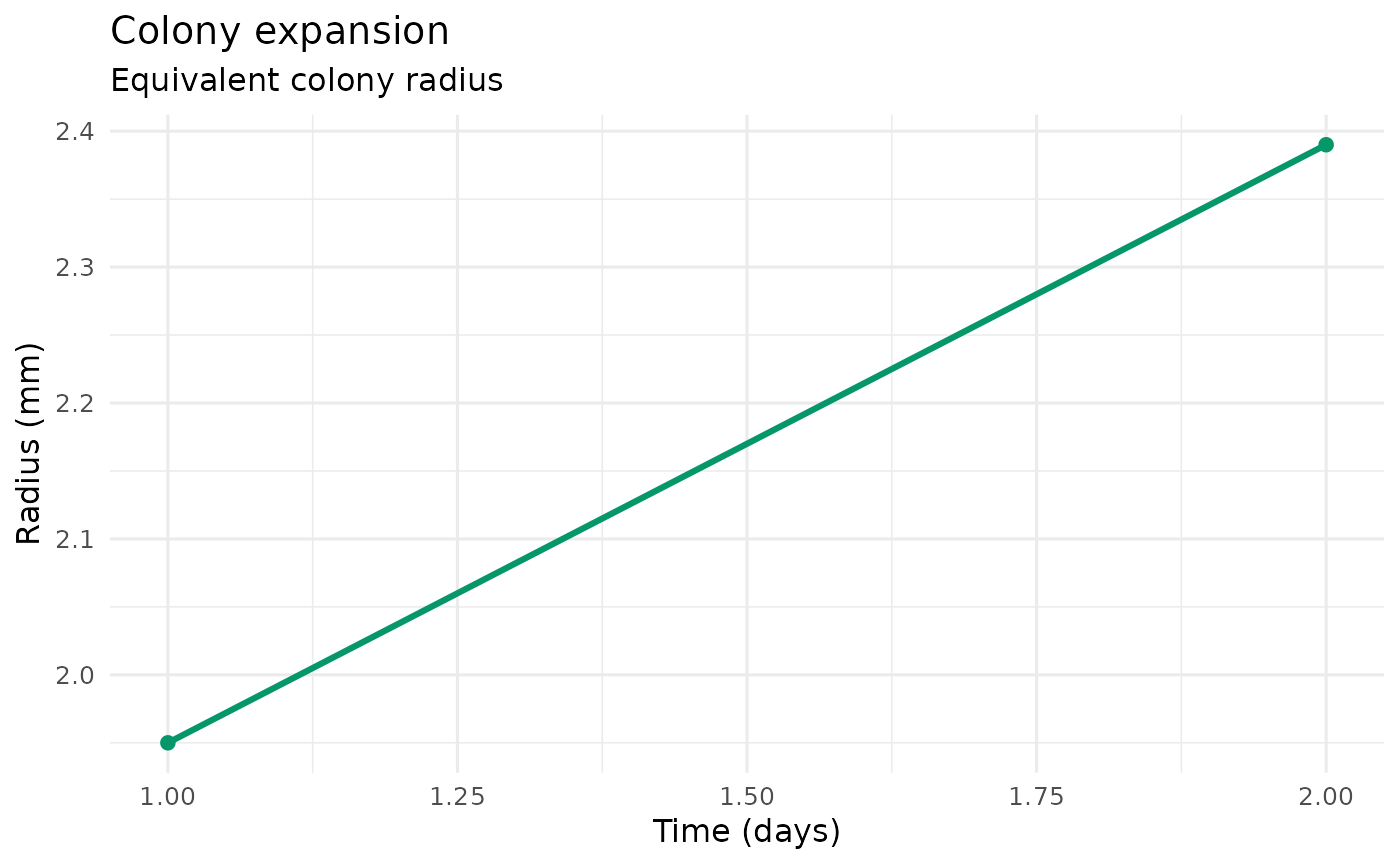
Draws equivalent colony radius (mm) against time (days) as a line + point
plot using the ggplot2 theme_minimal style.
Arguments
- x
A
grayleafspot_runobject, data frame, or list accepted byas_grayleafspot_growth_data().
Examples
run <- example_grayleafspot_results()
plot_colony_expansion(run)